Isointerval contour plots on triangle meshes in Matlab
Alec Jacobson
February 29, 2012
Matlab let's you plot contours of scalar functions defined on grid-surfaces. But this is not easily achieved if you're working with a triangle mesh. I had previously attempted to achieve this by first resampling the function onto a grid surface and then using Matlab's built-in contour. This eventually (very slowly) gives you nice contour intervals and isolines separating them, but it makes the boundary of the domain ugly and doesn't easily extend to 3d surfaces.
But now I've found that using the right colormap and the right rendering flags you can get pretty close to that sort of contour plot without the slow resampling step. The trick seems to be using a relatively small colormap and setting the 'FaceLighting' flag to 'phong' and the 'FaceColor' flag to 'interp'. If your mesh is in V and F and you have some scalar functions in the columns of W then you can render 10 isointervals of alternating green and yellow using:
t = trisurf(F,V(:,1),V(:,2),V(:,3),W(:,5),'EdgeColor','none','FaceColor','interp','FaceLighting','phong');
colormap(repmat([1.0 0.95 0;0.1 0.5 0.2],10/2,1));
light('Position',[-1.0,-1.0,100.0],'Style','infinite');
axis equal;
view(2);

Note: the light command is not necessary to achieve sharp isointervals. But the setting the face "lighting" to 'phong' is necessary
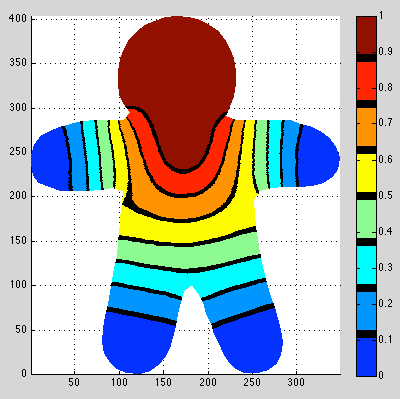
And with a little effort, you can achieve something close to isointervals separated by isolines:
% number of isointervals
nin = 8;
M = jet(nin);
% thickness ratio of each isointerval compared to "isoline"
thickness = 10;
MM = reshape(permute(cat(3,repmat(M,[1 1 thickness]),zeros([nin 3 1])),[3 1 2]),nin*thickness + nin,3);
colormap(MM)
colorbar

Or on a 2D mesh without the light call:


