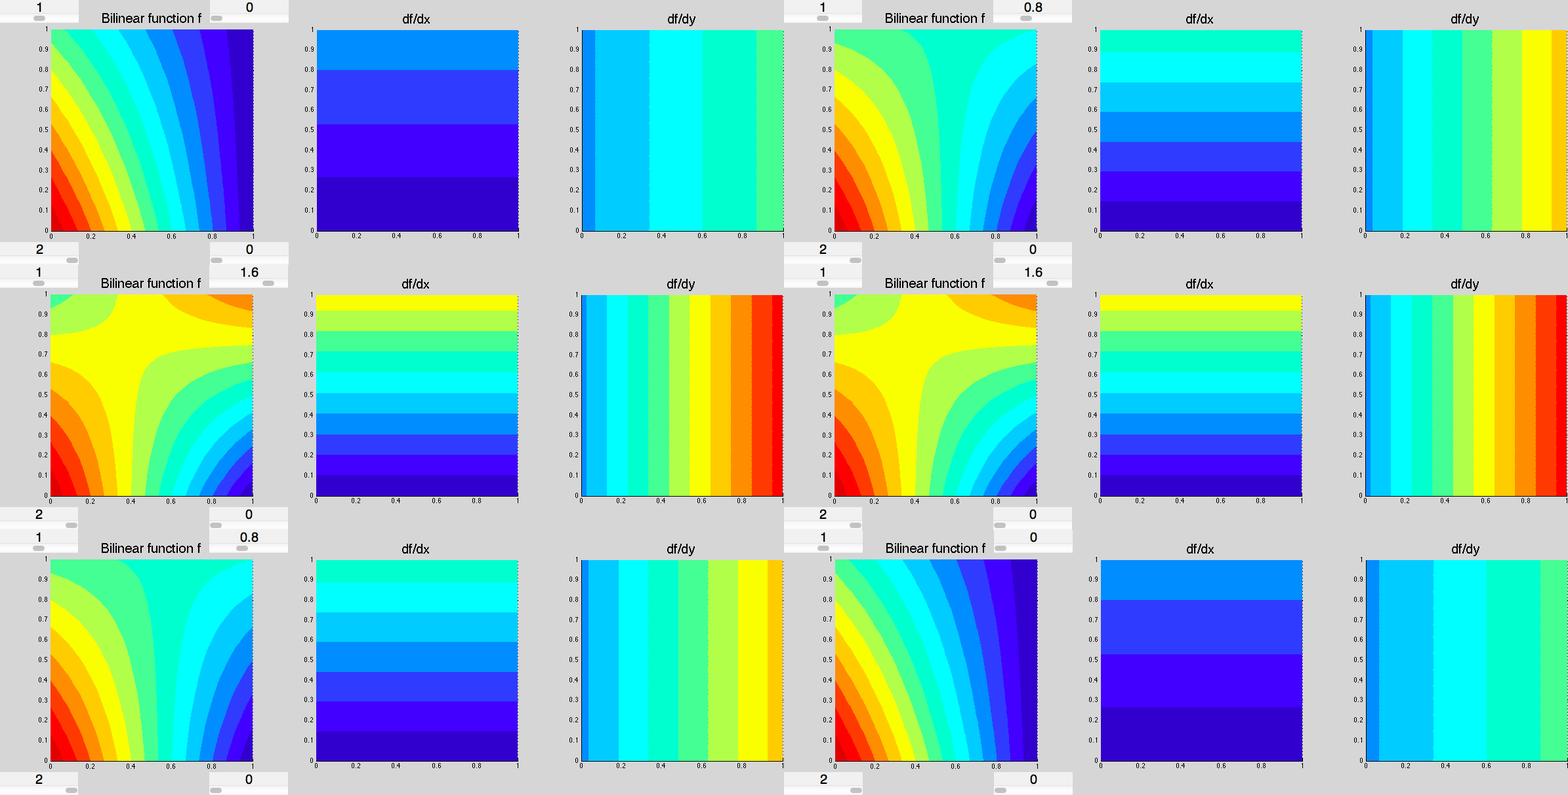
Interactive bilinear interpolation visualization with derivatives in matlab
Alec Jacobson
July 19, 2013
 Here's a little matlab gui to play with a bilinar function in a square, visualizing its value and partial derivatives with respect to x and y. Save it into a file
 bilinear_interactive.m.
function bilinear_interactive()
  % BILINEAR_INTERACTIVE Create a little GUI to play with a bilinar function in
  % a square, visualizing its value and partial derivatives with respect to x
  % and y.
  %
  % bilinear_interactive()
  %

  clf;
  [V,F] = create_regular_grid(50,50,0,0);
  corner = [1 1 2 0];
  bi = @(x,y,a,b,c,d) y.*(a+x.*(b-a)) + (1-y).*(c+x.*(d-c));
  grad_bi_x = @(x,y,a,b,c,d) y.*((b-a)-(d-c))+(d-c);
  grad_bi_y = @(x,y,a,b,c,d) x.*((b-a)-(d-c))+(a-c);

  subplot(1,3,1);
  tsh = trisurf(F,V(:,1),V(:,2), ...
    bi(V(:,1),V(:,2),corner(1),corner(2),corner(3),corner(4)), ...
    'EdgeColor','none','FaceColor','inter','FaceLighting','phong');
  caxis([0 2]);
  title('Bilinear function f','FontSize',20);
  colormap(jet(15));
  axis equal;
  view(2);

  subplot(1,3,2);
  xsh = trisurf(F,V(:,1),V(:,2), ...
    grad_bi_x(V(:,1),V(:,2),corner(1),corner(2),corner(3),corner(4)), ...
    'EdgeColor','none','FaceColor','inter','FaceLighting','phong');
  axis equal;
  caxis([-2 2]);
  title('df/dx','FontSize',20);
  view(2);

  subplot(1,3,3);
  ysh = trisurf(F,V(:,1),V(:,2), ...
    grad_bi_y(V(:,1),V(:,2),corner(1),corner(2),corner(3),corner(4)), ...
    'EdgeColor','none','FaceColor','inter','FaceLighting','phong');
  axis equal;
  title('df/dy','FontSize',20);
  caxis([-2 2]);
  view(2);

  set(gcf,'Position',[1 1 1440 830]);
  pos = [ ...
    [150-40 110+500 120 20];
    [450-20 110+500 120 20];
    [150-40 40+200  120 20];
    [450-20 40+200  120 20];];
  label = zeros(1,4);
  for ind = 1:4
    label(ind) = uicontrol('Style', 'text',...
      'Position',pos(ind,:), ...
      'FontSize',20, ...
      'String',num2str(corner(ind)));
    uicontrol('Style', 'slider',...
      'Min',0,'Max',2, ...
      'Value',corner(ind), ...
      'Position',get(label(ind),'Position')-[0 20 0 0], ...
      'Callback', @(src,evt) update(get(src,'Value'),ind));
  end

  function update(val,ind)
    corner(ind) = val;
    Z = bi(V(:,1),V(:,2),corner(1),corner(2),corner(3),corner(4));
    set(label(ind),'String',num2str(val));
    set(tsh,'Vertices',[V Z],'CData',Z);
    Z = grad_bi_x(V(:,1),V(:,2),corner(1),corner(2),corner(3),corner(4));
    set(xsh,'Vertices',[V Z],'CData',Z);
    Z = grad_bi_y(V(:,1),V(:,2),corner(1),corner(2),corner(3),corner(4));
    set(ysh,'Vertices',[V Z],'CData',Z);
    drawnow;
  end
end
 Here's a little matlab gui to play with a bilinar function in a square, visualizing its value and partial derivatives with respect to x and y. Save it into a file