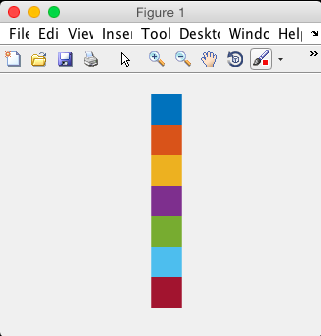

I couldn't find any documentation about where the plot line colors are stored or how to access them. Here's a hacky way to retrieve them. Currently plot cycles through 7 colors:
p = plot(repmat(1:7,2,1));
plot_colors = reshape([p.Color],3,7)';

Update:
The correct way as Daniele writes in the comments is:
get(groot,'defaultAxesColorOrder')