 Indeed, feature charts are a visually compelling way to make a categorical argument.
It's common to defend a new method by writing down the existing methods in rows, listing features in columns. If the new method satisfies all or most of the features then it's declared a winner. Some papers refer to the features or properties as "desiderata" invoking the idea that these are the things you'd write down that you want before ever considering which methods exist or fulfill them.
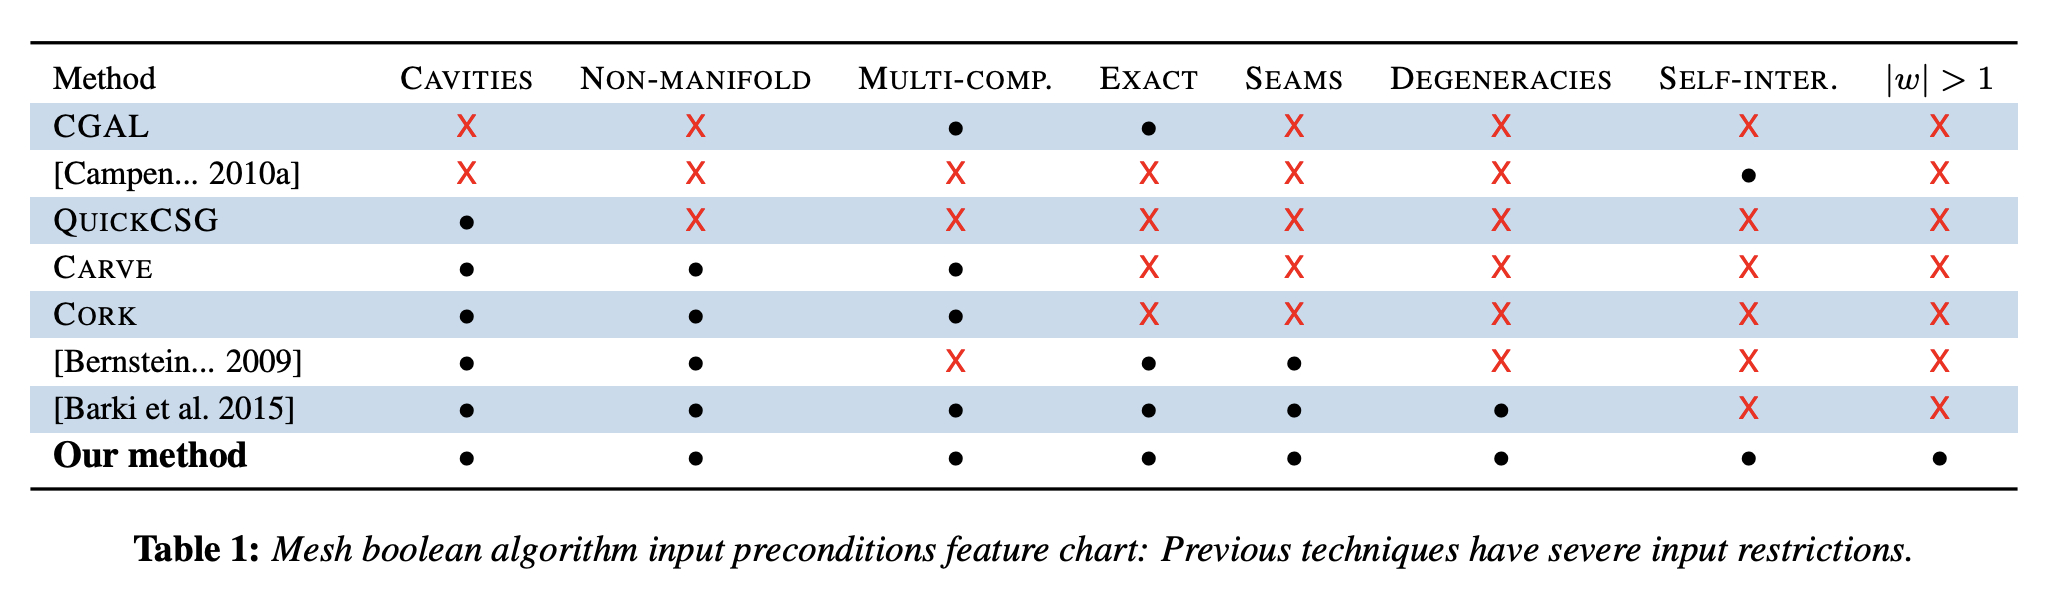
Here's a feature chart from my own paper, "Mesh Arrangements for Solid Geometry":
Indeed, feature charts are a visually compelling way to make a categorical argument.
Reviewers, authors and readers are well trained to suspect a missing row, that is, a missing prior method to compare to. But there's perhaps a more insidious problem: a missing feature column.
Intentional or not, sometimes we have invented a new method before we fully registered which features are important. It's tempting to stop looking for columns once there are enough features to rule out the previous methods and score 100% across the Our Method row. This can happen without consciously witholding or ignoring a feature column.
When we reporting the findings, the chronology can easily get reversed. Papers may write something of the form "These five desiderata define our notion of a correct algorithm. Given these goals, how well do existing methods perform?" And, surprise, surprise, the performed method satisfies all five features.
This problem is similar to p-hacking in statistics, where a researcher (intentionally or not) tries many statistical tests until one of them is significant.
Just like p-hacking, it's easy to see how the human aspect of doing research can get in the way of reasoning. Suppose we discover an interesting new algorithm "O". Playing around with it we realize it has great properties "1", "2", and "3". Getting excited that this might be worth sharing to the world as a publication we look up the comparable algorithms "A", "B", and "C" and find that none of them have all three properties. Our feature chart looks great:
| Feature 1 | Feature 2 | Feature 3 | |
|---|---|---|---|
| Method A | ❌ | ✅ | ✅ |
| Method B | ✅ | ❌ | ✅ |
| Method C | ✅ | ✅ | ❌ |
| Method O | ✅ | ✅ | ✅ |
A lot of the anxiety before submitting a paper comes from worrying that we haven't read all of the existing literature. If we encounter another method that satisfies all three properties, we might scuttle the submission. By accepting our own choice of which features are important, we can easily be blindsided by a feature "4" that we didn't even consider or know to consider. This feature could reveal a less obvious win for our method. For example, it could affect the desiderata chart as:
| Feature 1 | Feature 2 | Feature 3 | Feature 4 | |
|---|---|---|---|---|
| Method A | ❌ | ✅ | ✅ | ❌ |
| Method B | ✅ | ❌ | ✅ | ✅ |
| Method C | ✅ | ✅ | ❌ | ✅ |
| Method O | ✅ | ✅ | ✅ | ❌ |
While our method "O" maintains its feature dominance over method "A", it's no longer clear whether method "O" is categorically preferable better over methods "B" or "C". That decision no requires weighing the importance of our missing feature "4" against features "2" and "3".
Feature charts also show up in papers that are not proposing new methods, but studying existing ones. The risks persist. consider this story about the origin of the "Discrete Laplace operators: No free lunch" [Wardetzky 2007] paper. The final version of the paper includes a feature chart:
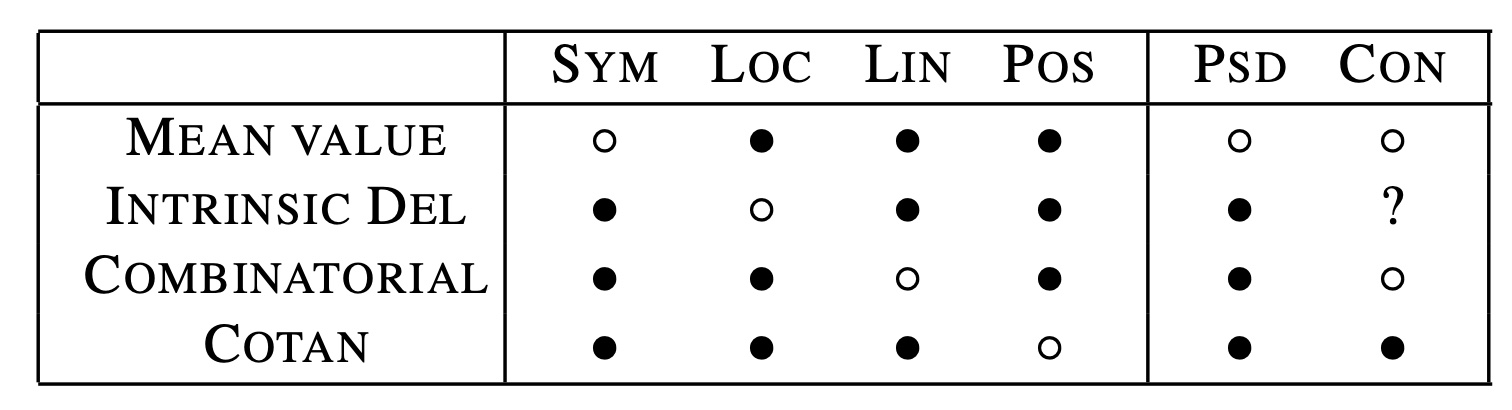
The premise of this paper starts with the observation that none of the four
methods in the rows satisfies all of the first four features in the columns.
According to an inside story1, the original research had one fewer row and one fewer
column and would have lookd like this:
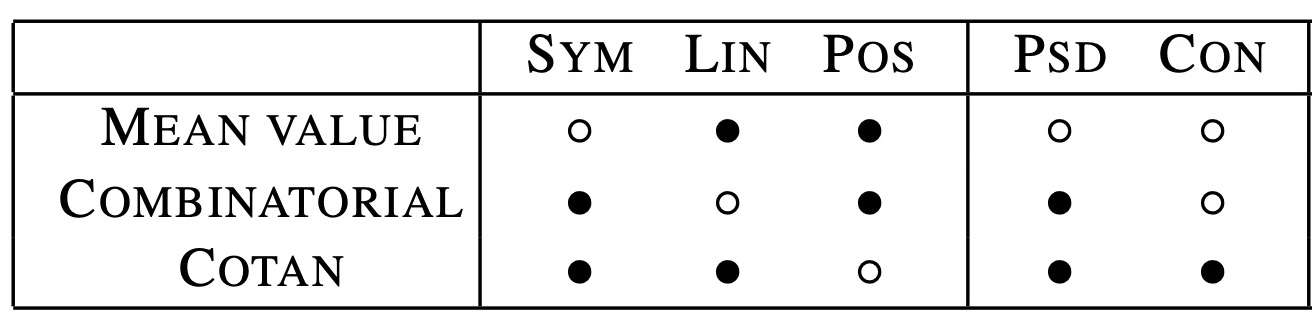 This time there are only three methods and three core features, but still we have no method that satisfies all features.
Before publication, friends at Caltech revealed that they were about to publish a new method for constructing instrinsic Delaunay Laplacians (the Intrinsic Del row). This soured the premise. Suddenly, a method would soon be announced that would indeed satisfy all three features.
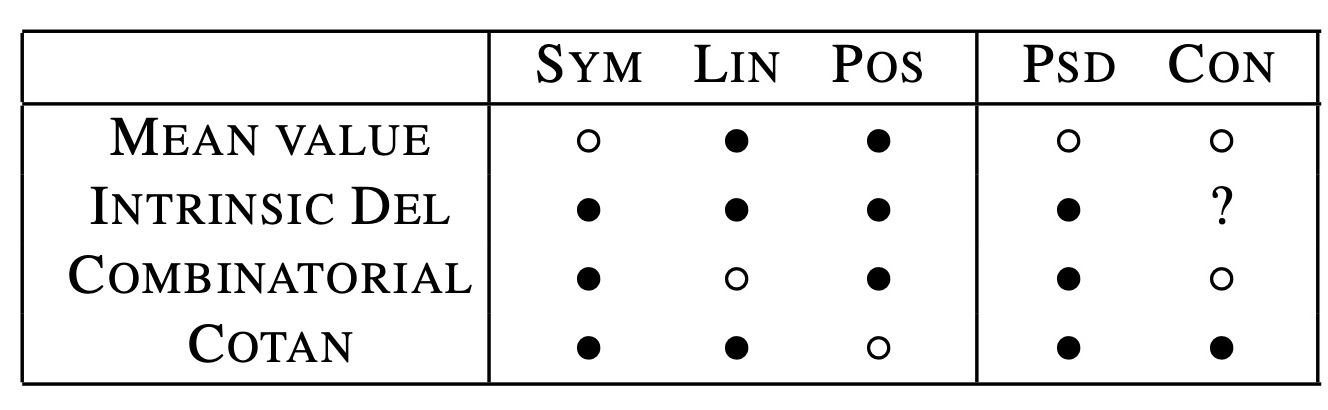
Fortunately, the authors of the no-free-lunch paper were able to add a fourth feature column to the chart: mesh locality. Even more fortunately (for science), they went further and proved a theorem that no method could ever satisfy all four features.
The story continued many years later, when enthusiasm for this theorem was dampened a bit by the argument that the mesh locality feature column is perhaps not as important as geometric locality (yet another potential missing column), for which the intrinsic Delaunay method achieves with only minimal amortized performance overhead for typical meshes.2
Here's another one from one of my first papers, "Bounded Biharmonic Weights for Real-Time Deformation". One of the "Y*
(only experimental confirmation)" features was disproved almost immediately
after publication.
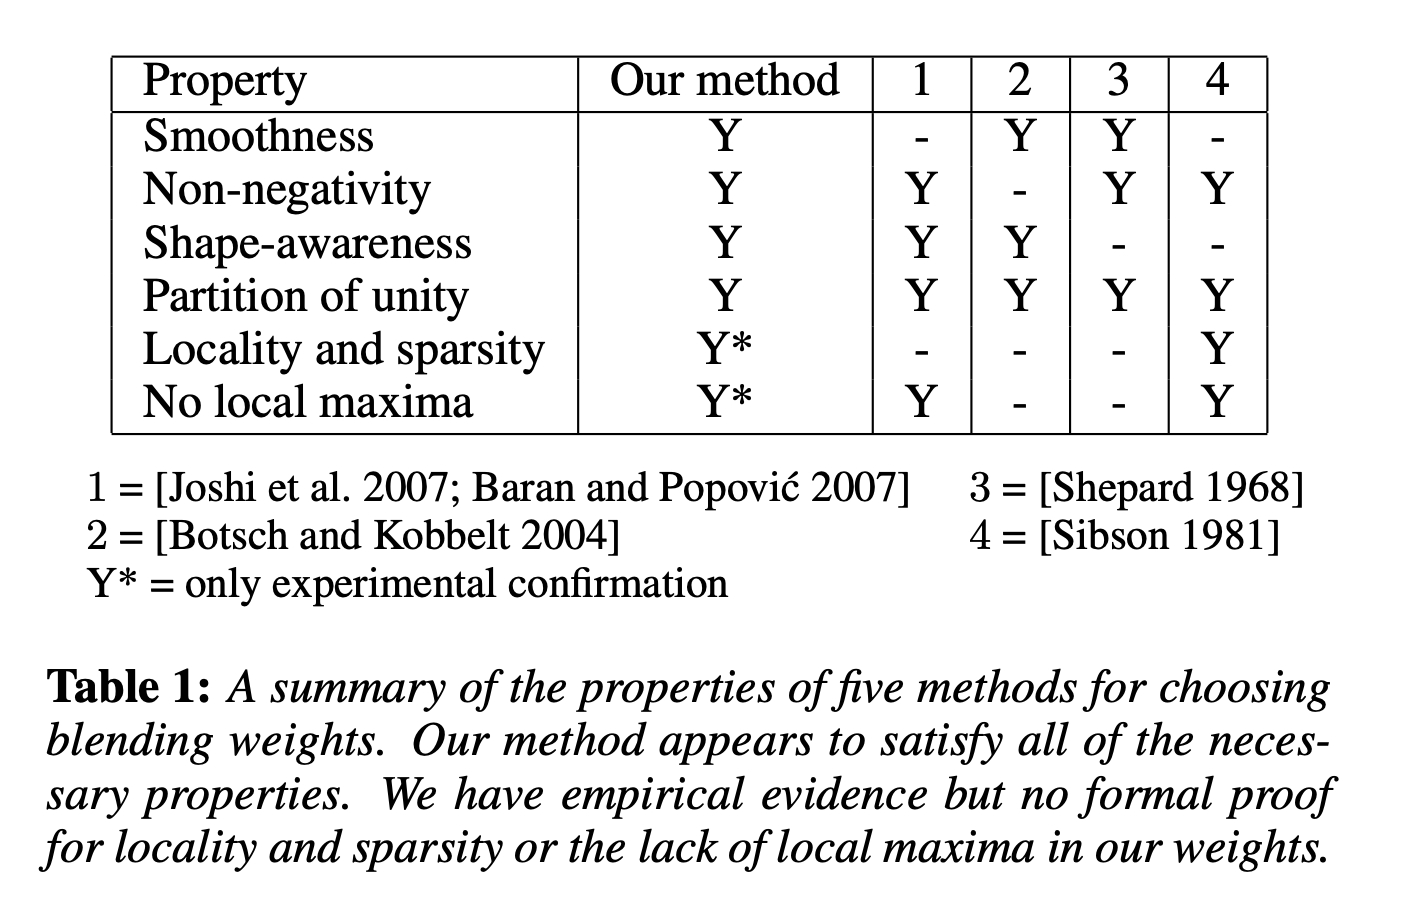 It's embarassing to essentially find evidence that we didn't do enough experiments in the first place. The chart should have been:
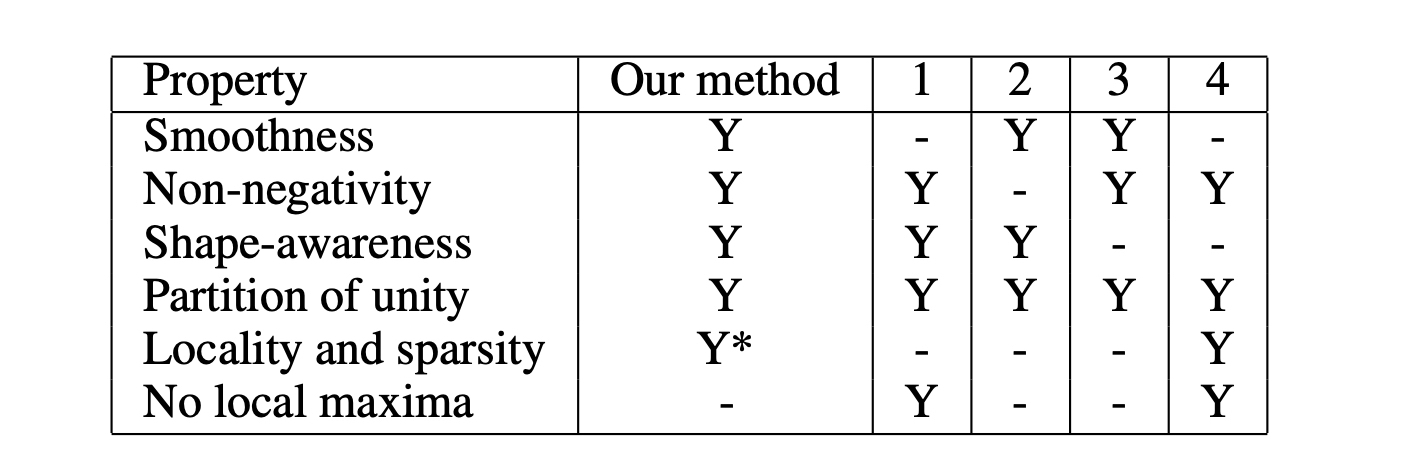 Discovering this flaw and proposing a fix lead to a follow-up paper, but we certainly misled our audience with the "Y*" in the original.
In retrospect, I'm happy we still included this feature with an
asterisk in the original as it at least created a clear record of our current understanding for
future work to build on.
Discovering this flaw and proposing a fix lead to a follow-up paper, but we certainly misled our audience with the "Y*" in the original.
In retrospect, I'm happy we still included this feature with an
asterisk in the original as it at least created a clear record of our current understanding for
future work to build on.
So, are desiderate considered harmful? Not quite. But in the same way that a p-value is not completely harmful. We should be aware of the weaknesses of feature charts as critical readers. We should always ask, what method rows are missing? what feature columns are missing? As researchers, we would also benefit from —at least informally— pre-registering our desiderata.
Indeed, the feature chart itself is just a visual representation of the categorical justification of a new method. Desiderata hacking can happen even if it manifests in the prose of the introduction or related works section of a paper without a literal chart. The key problem at heart is post facto generation of feature columns. Similarly, many publications include impressive feature charts near the front of the paper and then only oliquiely allude to missing features in the final paragraphs deep at the end of the paper.
1 Recounted from memory of a conversation with one of the authors.
2See "Geometry Processing with Intrinsic Triangulations" [Sharp et al. 2021]